

I’m thinking about trend lines and what it means that three different statistical measures of variation return different results. I’ve slowed down in my drafting of the actual chapter so I’m going to blog a little to see if I can’t figure out what I think.
In plain English (or my attempt thereof):
SD measures how spread out all weights are from the average (mean).
IQR measures how spread out out the middle 50% of the weights are from the midpoint (median).
MAD is the average distance between the mean and the individual weights.
IQR and MAD are less likely to be effected by data outliers.
Here are pics (again sorry about the boring grey):
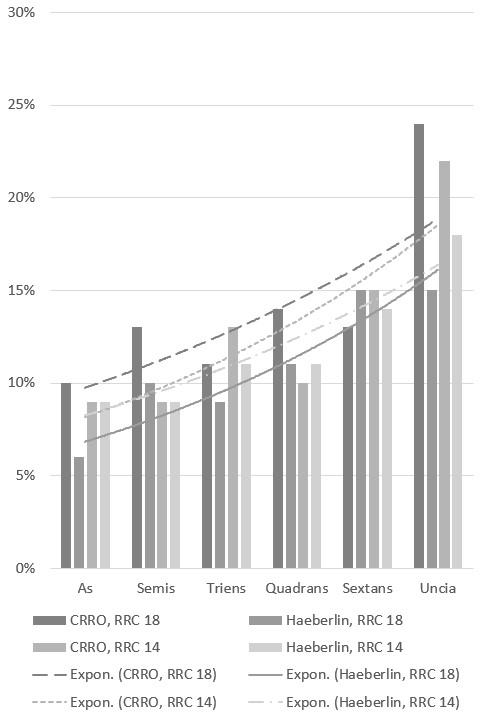
SD:

If we just looked at SD we could say that the trendline of RRC 14 regardless of dataset was flatter. I.e. that the overall pattern that small denominations were made with less conformity to a weight standard would be a more pronounced feature of RRC 18. OR to put it another way SD makes RRC 18 looks it becomes slopier faster in the lower denomination if over all has less variation than RRC 14. Maybe only that last point is relevant maybe the angle of the trendline is less historically meaningful?
IQR:
IQR starts to get messy. According to CRRO data RRC 18 demonstrates more variation than RRC 14, whereas Haeberlin suggests the reverse. Both of these things cannot be true of the original population (all RRC 18 and all RRC 14 made). One dataset must be a more accurate reflection of the original population than the other. Which do I believe?
Haeberlin is bigger. But he might have been more dismissive of outlier. BUT IQR is supposed to be less effected by outliers.
CRRO is smaller. But maybe the weights are more ‘modern’ (as long as the objects were re weighed and not just copied off of ancient tags which lets be realistic they may well have been). It shows more variation by every measure in all instances. Is its data not uniform because the sample sizes are too small? OR because museum collections record everything?
Here for Haeberlin, RRC 14 has a flatter trend line than RRC 18. BUT for CRRO, RRC 18 has a flatter trendline than RRC 14. Again both cannot be true of the original population.
MAD:

MAD is just as messy. Again we have a historical impossibility: CRRO data RRC 18 demonstrates more variation than RRC 14, whereas Haeberlin suggests the reverse.
Here for Both CRRO and Haeberlin, RRC 14 has a flatter trendline than RRC 18. This agrees with the picture of the SD but not the IQR. However here as compared to SD the trend is much more pronounced.
I find myself leaning towards Haeberlin. Why? I like the consistence through all three measures. Is this a good reason? I am doubtful of that. The larger sample size is also comforting. But is he accurate? I think so. I did some weighing in Copenhagen and it was reassuring. I need to cross reference my notes on my reweighing with the printed weights in Haeberlin still but the curator thought Haeberlin’s weights were those on the tags and if so then they were pretty close to my reweighing…….. Okay I’ll let this sit a bit in my brain.
